
To date, speed has taken a backseat when it comes to websites. But today, there’s no denying it– fast websites are effective websites. When a website provides users with underwhelming performance, everything from SEO rankings to conversion rates, ecommerce sales, and general user experience takes a hit. So — how do you get the faster site you need?
You optimize your site for speed and performance.
That’s a very simple answer to a pretty complicated question, of course. Getting your website to a high-performance tier and keeping it there requires a lot of work. Specifically, it requires monitoring that site on an ongoing basis — and that the data collected is gathered under consistent testing conditions.
This work is inarguably worth doing, but starting the work may seem daunting. Use this guide as a launching point, and begin collecting and monitoring the data necessary to achieve exceptional website performance.
Successful Website Performance Monitoring Requires the Right Tool and the Right Method
When you start digging through website analytics and aren’t happy with what you see, you’ll be anxious to make some changes. It’s important not to rush into website speed optimization without the right tool in hand, though.
There are a few different methods of testing website performance. One is to take a snapshot of how a site performs at any given moment. A tool like Google’s PageSpeed Insights (PSI) is fine for that. However, certain inconsistencies in the tool’s functionality, such as actual server location, mean that it’s not very useful for long-term monitoring. Too many variables exist for meaningful data comparison over time.
Other tools, such as Calibre or SpeedCurve, are much more useful for continuous website performance monitoring. They eliminate inconsistencies with server location and certain network conditions. They also work best for those companies fully committed both to ongoing website performance monitoring and site speed optimization efforts. Not everyone is ready to make that commitment — paying for a service, dedicating time and resources to gathering and reviewing data, and then actually optimizing for speed.
A DIY Approach for Starting Out with Ongoing Performance Monitoring
If you’re ready to start continuously monitoring website performance — and you want more than one-off test results without committing to a more advanced service — consider our recommended DIY approach. Note– this method requires a good practical knowledge of spreadsheets.
Choosing the Right Tool for Getting Started with Website Performance Monitoring
One benefit of using PageSpeed Insights and getting that one-off performance evaluation report is the fact that it’s free to use. It’s not the only free tool out there, though. To get up and running with website performance monitoring and speed optimization, we recommend using webpagetest.org (WPT). WPT is also a free tool, but offers the type of control you simply don’t get with a one-off solution like PSI (which, to be clear, does have its uses — just not for ongoing performance monitoring and testing).
Test Your Site While Maintaining Control
Control in this context means eliminating the types of variables that certain tools introduce during testing — and which can mislead you when comparing data from different tests. To present meaningful data for evaluating ongoing website optimization efforts, a good DIY tool must allow you to:
- Decide where requests originate from.
- Choose the network conditions under which your request is handled.
- Select which browsers you want to test for.
Without this type of control ruling out the unpredictable conditions of one-off testing tools, it’s not possible to make meaningful comparisons of data over time. Additionally, you should absolutely look for a tool that produces a Lighthouse report. In fact, if webpagetest.org did not provide a Lighthouse report in its testing, we’d look for an alternative to recommend. These metrics are that important.
Running Your Own Tests
To keep things simple for the purposes of this article, let’s see what it looks like to run the simplest test for our ChromaticHQ.com homepage. We’ll select the Simple Testing tab (direct link to Simple Testing), enter our URL, and enable Run Lighthouse Audit. Notice that Test Configuration is left as the default (Mobile - Fast 3G); more on this later. This configuration will run three performance test runs against the URL that you’ve provided. The data for all three tests will be available once the test is completed, but by default, it will show you the data for the median run (that is, not the best nor the worst of the three, but the one in the middle; that’s the one we want).
Here’s what our configuration looks like on WPT:

Once we’ve filled out this simple form, we can click the Start Test button on the right, which will submit our test request and bring us to this page:
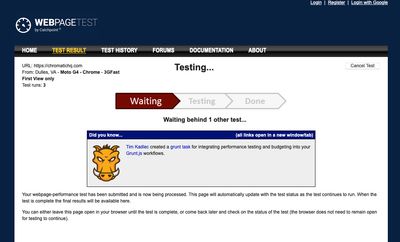
Keep that page open for a bit and you will eventually see that your tests are running:
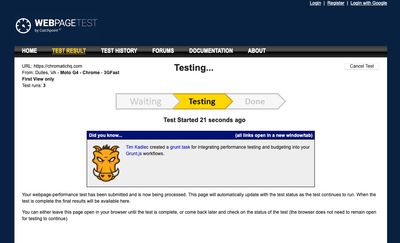
And, after a few minutes, your tests will be ready:
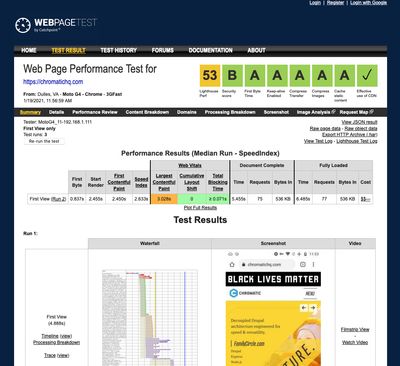
Congratulations! You’ve taken the first step in your performance monitoring journey.
Before we move on to the next step, you should do the following:
- Make note of the First Byte metric. The table under the Performance Results (Median Run - SpeedIndex) heading has a First Byte column. Write down the value recorded under that column (0.837s in the above screenshot).
- Open your Lighthouse Performance report. You can do this by clicking on the first box near the top right that has the label Lighthouse Perf below it. That link points to the Lighthouse Performance report for the median run by default.
Capturing Results and Visualize Progress with a Performance Tracking Spreadsheet
Once you have opened your Lighthouse Performance report, you’ll be ready to move on to the next step: adding them to a spreadsheet to compare test results over time. Anyone can do this, but it does take a bit of time and effort to set up. Luckily, we’ve created a boilerplate spreadsheet to get you started.
We based this spreadsheet on the tools we at Chromatic have used internally to help inform our performance efforts for our own clients and agency partners. Using this tool, you’ll be able to easily enter your test result data, visualize your progress, and focus on the metrics that will help your team succeed.
The tool is complete with sample anonymized data, production and staging comparisons (should you want to test both), multiple pages, and configurable goals. It’s packed with enough features to kickstart your long-term performance monitoring strategy.
Download our DIY performance tracking spreadsheet
...and begin monitoring your site today.
Focus on Key Metrics
Once you have your test results, you can add them to your spreadsheet. At Chromatic we usually focus on six key metrics that will increase our Lighthouse Performance Score:
- First Contentful Paint (FCP)
- Speed Index (SI)
- Largest Contentful Paint (LCP)
- Time to Interactive (TTI)
- Total Blocking Time (TBT)
- Cumulative Layout Shift (CLS)
All of these metrics are displayed front and center in the Lighthouse Performance report you got from WebPageTest.
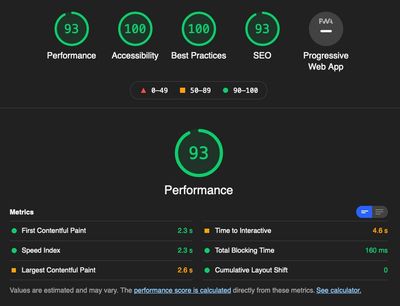
Additionally, we also keep an eye on Time to First Byte (TTFB), as a high TTFB may be indicative of inadequate caching on the server.
At-a-Glance Metrics Monitoring
We recommend organizing your data in a way that allows you to make evaluations at a glance. Create a view presenting all of your main metrics in a cascading format — most recent to oldest.
Once you’ve recorded several performance snapshots and establish a historical record, you can find ways to highlight them in your spreadsheet to help spotlight trends over time. Here, we’ve color-coded them to indicate how they measure up against goals:
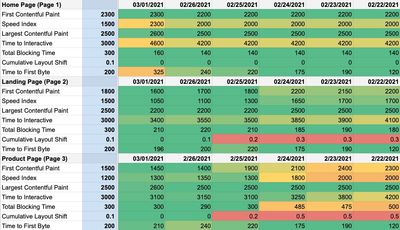
Look for trends. If you’re making steady progress from, say, red to green on the metrics you’re tracking, then your efforts are paying off. If you’re seeing no change, or if you’re moving from green to orange to red in certain areas, you know you have problems to address.
Depending on your spreadsheet skills, you could even plot one or more charts to help visualize the effects of your performance optimization efforts. All of this crafts a story of your website’s speed and perceived performance, giving everyone on the team a clear picture of where to focus efforts.
Quick Tips for Fine-Tuning Performance Testing
- Aim to test daily, at the same time every day. Try adding a recurring to-do item on your calendar and set time aside every day to run your tests. It shouldn’t take very long and it will improve the reliability of your long-term monitoring efforts. It’s worth noting that it is possible to automate test submissions on WPT, as well as results retrieval, but automation is outside the scope of this article.
- Configure your tests for unfavorable conditions. It’s a good idea to target the lowest (or close to lowest) common denominator. Test for mid-to-low end devices on less-than-stellar network conditions. Optimizing for under-powered devices on slow networks automatically improves performance for higher-end devices on fast networks.
Where to Go Next with Your Continuous Website Performance Monitoring
To gain actionable website optimization insights you need the right data, collected under the right conditions, and organized in the right way. A free tool that guarantees consistency and a preloaded spreadsheet to get organized is plenty to get you going.
But what comes next?
You may be perfectly comfortable doing this type of analysis. Maybe you’ll try it out, see its value, and make the jump to a service like Calibre or SpeedCurve.
Or maybe you’ll realize just how necessary these insights are, but eventually hit a point where it’s just too much trouble to continue testing and organizing this way. Maybe you need help actually solving the problems you identify and optimizing your website for speed.
That’s where working with an experienced web development partner is invaluable.
At Chromatic, testing and optimization is built into our site building and maintenance practices. We understand the need for continuous performance monitoring — and we know how to do it for maximum results. If you’re ready to take your website’s performance to the next level, let’s talk.


