
Here at Chromatic, my day-to-day often involves having to solve front-end problems fast and editing pages in real-time to deliver a great product that delights our clients. Because of this, I almost always have Chrome DevTools open. Everyone has a favorite development tool for web debugging, but Chrome Devtools is my preference for the following reasons:
- Chrome is my default browser and DevTools is built-in--so there’s no need for plug-ins
- I’ve found Chrome DevTools’ UI to be the most seamless and intuitive out of all the other development tools out there.
- Chrome DevTools also has great integrations like Lighthouse which you can run from the Audits panel and generate a report on the page’s performance.
So if you are “Team DevTools,” read-on. And if you are not, read-on anyway and see if I can’t convert you. I’ve compiled a list of 9 tips and tricks I’ve found useful in my daily work. Some have been part of my toolkit for as long as I’ve been working, while others are recent discoveries that impressed me and made me want to use them at the first opportunity. For experienced DevTools users, some of the following may be familiar, but my hope is that they could serve as a refresher. Others may just surprise you.
1. Important Hotkeys
For the longest time, I was stuck in the bad habit of right clicking the page and clicking Inspect Element in instances when using Toggle Inspect Element Mode Command+Shift+C or Control+Shift+C (Windows and Linux) would have been more appropriate. I found it a little faster for my workflow when I can just easily hover over various elements on the page and quickly see the markup and styles fly open in the Elements panel. Right-clicking the element to inspect is fine, but if I wanted to move onto the next element, I had to right-click again, which did become cumbersome.
You don’t have to master all the hotkeys, but taking some time to read the documentation and memorizing a handful of them can certainly improve your workflow.
2. Customizing Your DevTools Environment
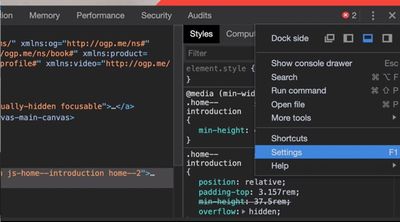
Customizing is key if you want a seamless experience when debugging. Are your eyes happier when you’re looking at code against a dark background? You can switch to Dark Mode by clicking this icon and then going to Settings > Preferences > Appearance:
Speaking of colors, did you know you can style your console messages?
You can add CSS as a parameter like, so:
console.log('%c Rosebud ', 'background: #FFD9F2; color: #8C005E');

console.table is also worth mentioning if you want to display tabular data as a table.
console.table(['March Hare', 'Mad Hatter', 'Dormouse']);

3. Adding new style rules
One common occurrence in my workflow is getting a brand new design through Zeplin or Sketch that already has automatically-generated CSS, which I’d have to convert into nested rules, variables, and mixins for existing .scss files. Before I plug away, I like to add the CSS to the production site without touching the codebase/repo to see how it plays with the page’s current style.
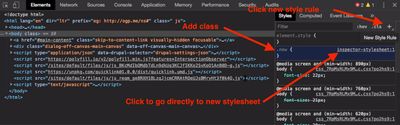
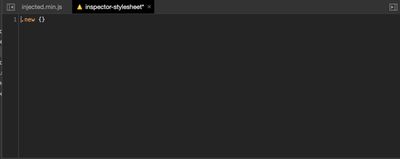
This is when I go to Elements > Styles tab and click the New Style Rule button. Once here, you can either add your custom class or just click inspector-stylesheet, which will open up a new tab, allowing you to add an entire stylesheet.
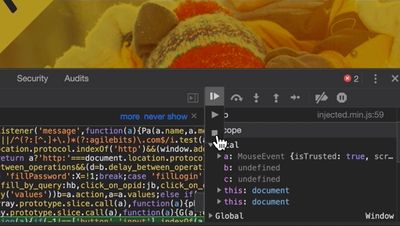
4. Reproducing JavaScript Bugs with Breakpoints
Many times, I need to debug JavaScript code for a codebase whose source I do not have access to. No problem. We can figure out where the code is breaking by pausing the code in the middle of execution using breakpoints. The best way to see this in action is through this Debugging JavaScript video from the Google Tools for Developers page. Once you finish this video, you should know your way around the Sources panel and be able to debug much faster.
5. Terminating script when in debug mode
Once you’ve learned how to step through code in the Sources panel, we should review how to terminate the script execution. For example, what if you find the function you are stepping through turns out to have an infinite loop? Or what if you were stepping into a function that utilizes jQuery and it keeps forcing you to step into the minified jQuery file?
In the past, I’d click the Resume script execution button over and over until it was done, or I’d have to close the inspector entirely. I’ve found that there is a better way, albeit slightly hidden. In the Sources panel, click “Pause”:
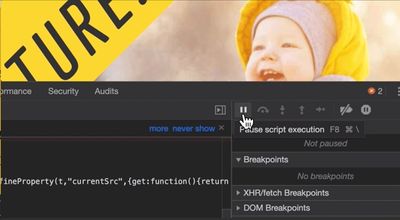
It will change to “Resume Script Execution”.
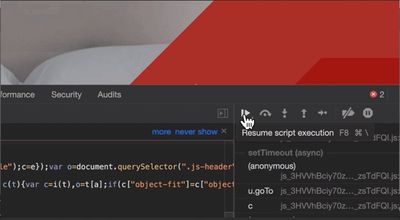
Press and hold “Resume Script Execution” then select “Stop Current JavaScript Call”.
6. Searching your scripts
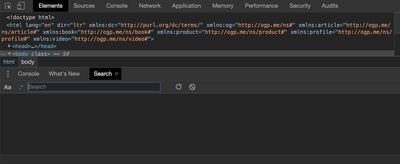
Now that we’ve gone over breakpoints and you know you want to pause at a specific function, how do you actually find where it is in the file so you can add the breakpoint in the right place?
Just press: Cmd + Option + F or Ctrl + Shift + F (Windows) – this allows you to search for any string, like yourTroublesomeFunctionName.
7. Pretty Print
What if you find the line of JavaScript you’ve been looking for, but it’s tucked in lines of unreadable/minified code? Just look for the pretty print button, which looks like this {}. In Chrome, you may find it in the Sources tab.
8. Blackboxing
I mentioned before that when I was stepping through the code, that the debugger was often stepping into minified jQuery code. If you want to avoid this completely, you can blackbox JavaScript source files.
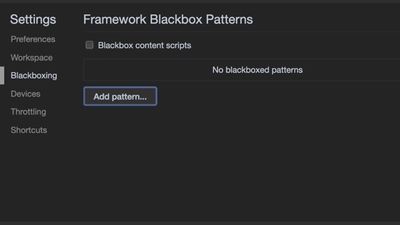
There are a few ways to do this, but the easiest way is to go to the Settings panel.
Then there is a list under settings that includes Blackboxing. Here, you can add any filename or matching regular expression.
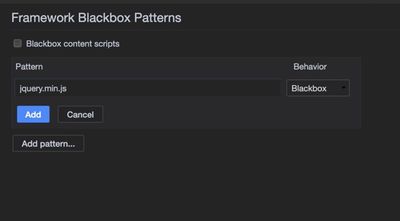
In the following example, DevTools will hide function calls from jquery.min.js from the call stack once a breakpoint is triggered:
9. Different ways to view function expressions and objects.
The easiest way to view a function definition is just to evaluate the function name in the console, like so.
Just don't forget that this is the active definition and defined only in the current scope.
What if you wanted to see all public variables and objects?
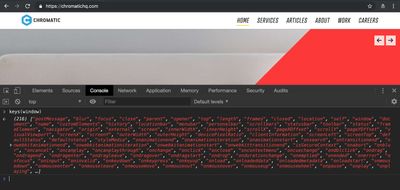
To see variables, you can try using the keys() function. See what happens when you type keys(window):
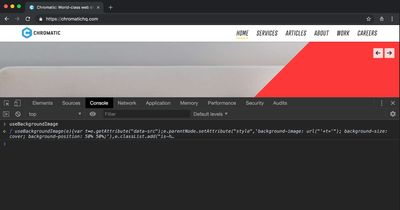
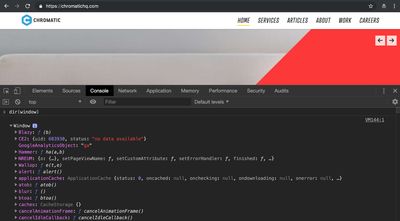
To see all objects, you can look into the dir() method which “allows you to display an object-style listing of all the specified object's properties.”
To see it in action, try typing dir(window)
To learn more about other convenience functions, check out Console Utilities API Reference in Google’s Web Fundamentals.
Conclusion
A common proverb I like is this: “If your only tool is a hammer then every problem looks like a nail.” It’s important we always select the right tool for the job, and not what is familiar in order to make our lives easier. While it’s not possible to learn every trick out there, I’ve found that dedicating time to learning something new about DevTools has improved my workflow and helped me debug faster.


